The $SPY managed to rally 2% for the week but a look under the hood suggests a multitude of currents. A host of end of week Chartly charts uncover many of the market’s nascent themes and opportunites.
Click through to find the original posting and larger view.
@WScottOneil is on Chartly and evidently he has done this before. 🙂
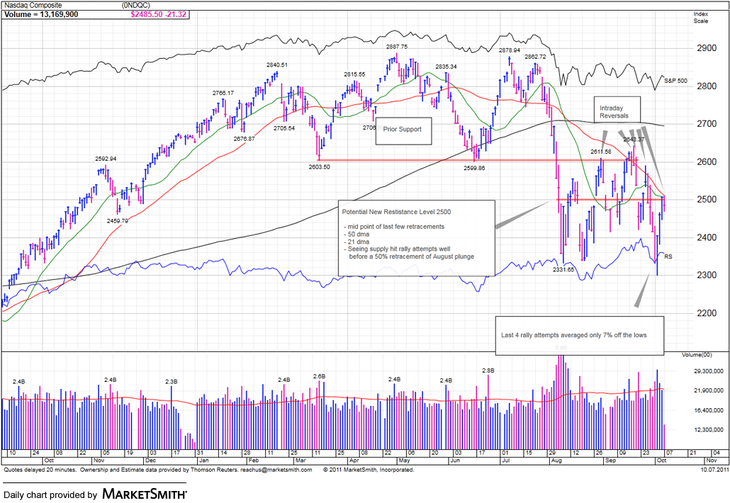
His one year study on the $COMPQ provides a look at potential resistance at the 50% retracement of past failed rally attempts.
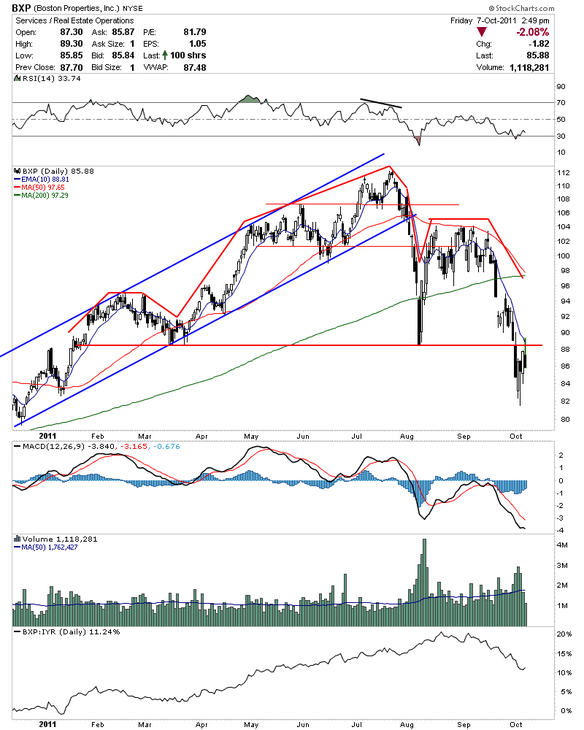
@Xiphos_Trading’s complete series on the REITs is well worthy of closer inspection and you can find it here. They’re weak as the $BXP chart attests:
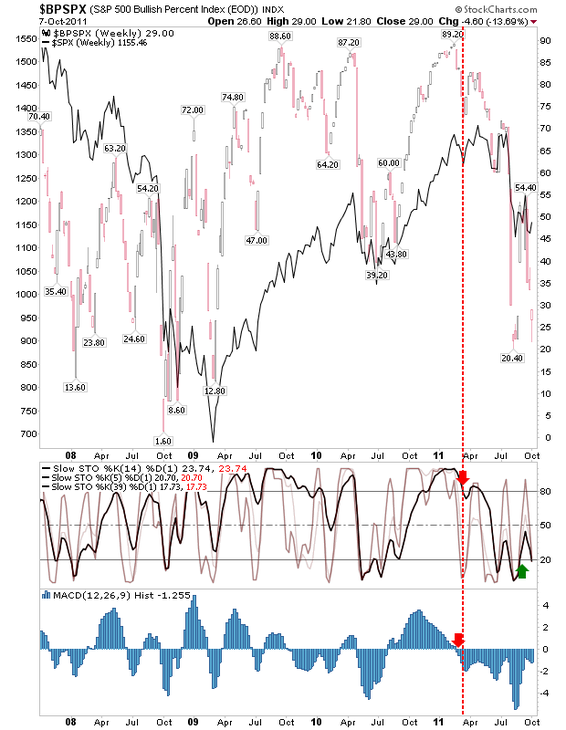
@fallongpicks highlight the $SPX Bullish Percents indicating breadth which, despite index strength this week, still took another step lower:
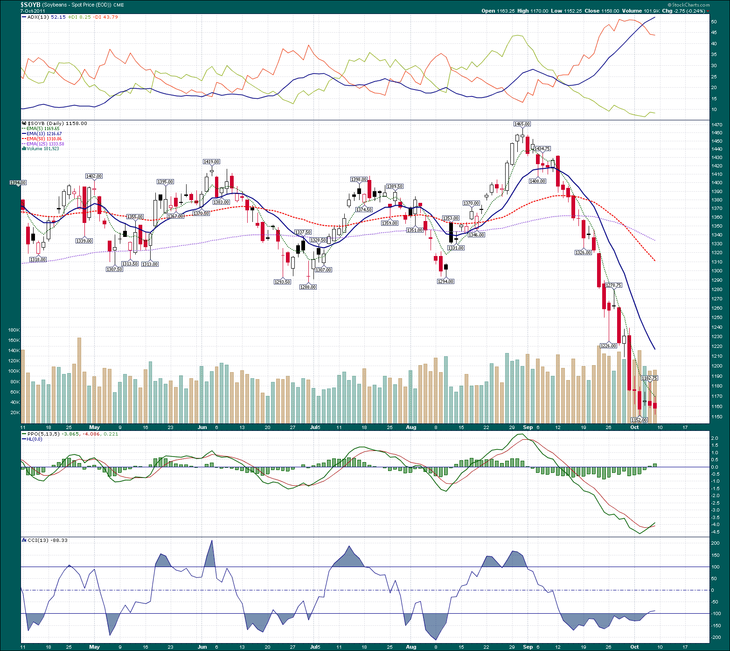
@kabushiki notes extreme weakness in Soybean Futures ($ZS_F). Still “no dice with the 5-day MA” so no bounce yet despite the cascade:
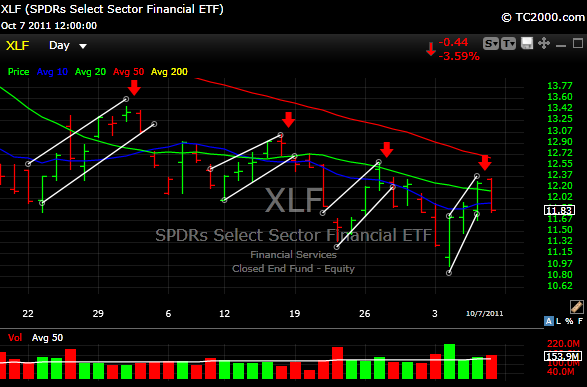
@upsidetrader points out the lower high series in the financials ($XLF).
And now for some pockets of light…
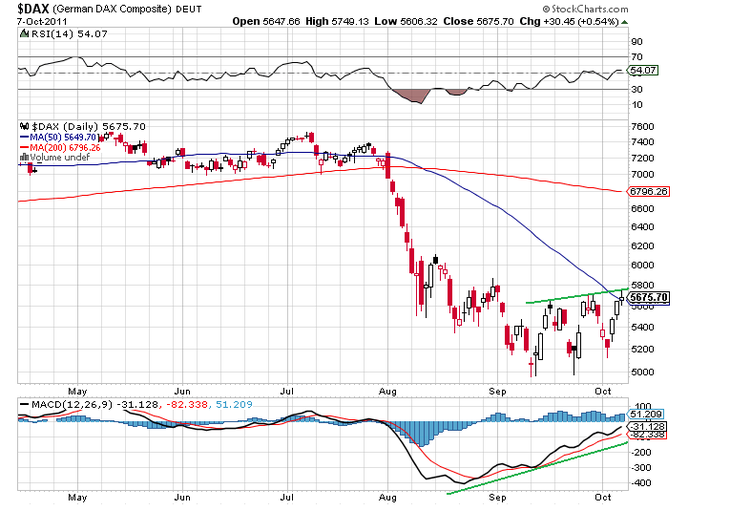
@1nvestor chalks up the potential for a move higher in Germany’s makets ($DAX)
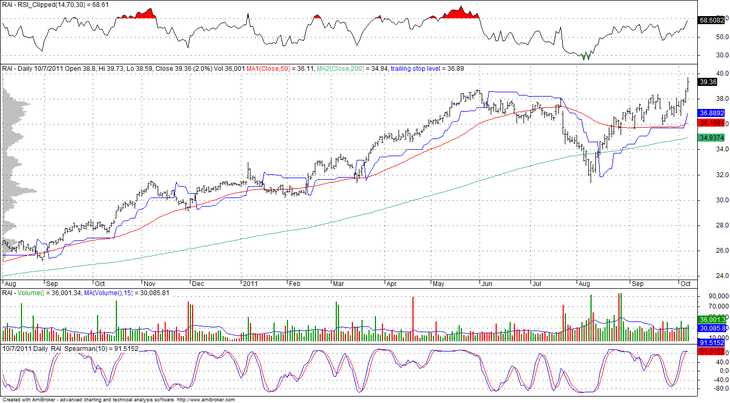
The @WhaleSongTrader finds a beauty here in Reynolds ($RAI) that pays a divvy to boot:
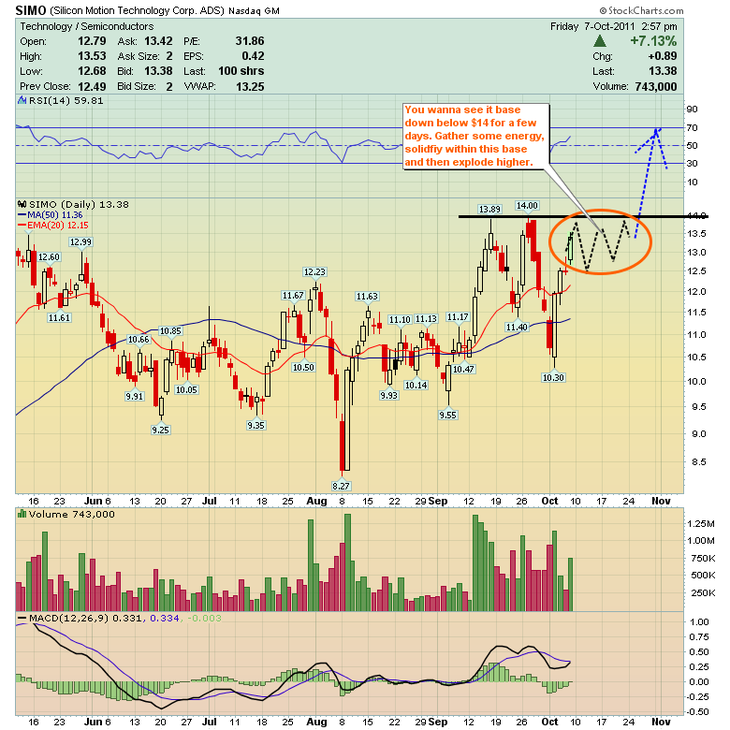
… And @traderstewie lays out a beautiful little setup here on $SIMO and what you want to look for to get long:


