


More than 100 $AAPL charts have been posted to the StockTwits Charts Stream in the last day. I pulled four of the many excellent ones as they are key here to keep an eye on…
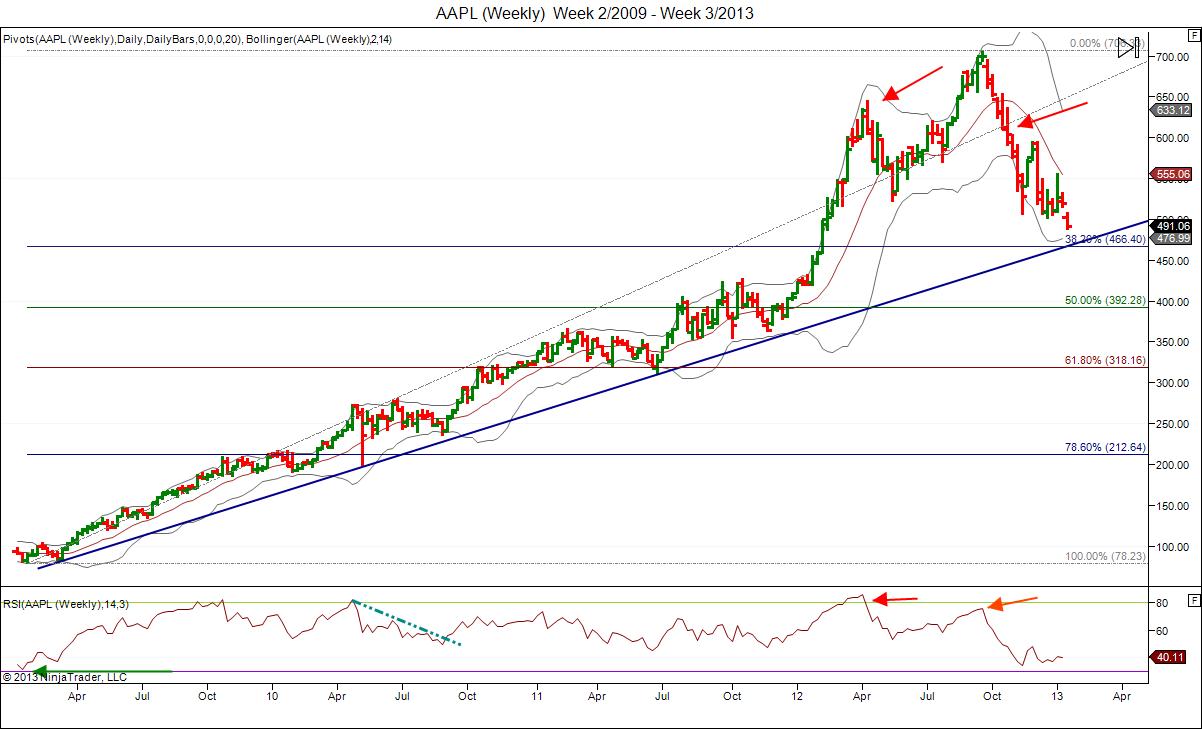
First, the Weekly via @stocktiger who notes the confluence of the major trend line and the 38.2% Fibonacci retracement level around 476. Great look and key key level.
Click Through on the charts for larger view.
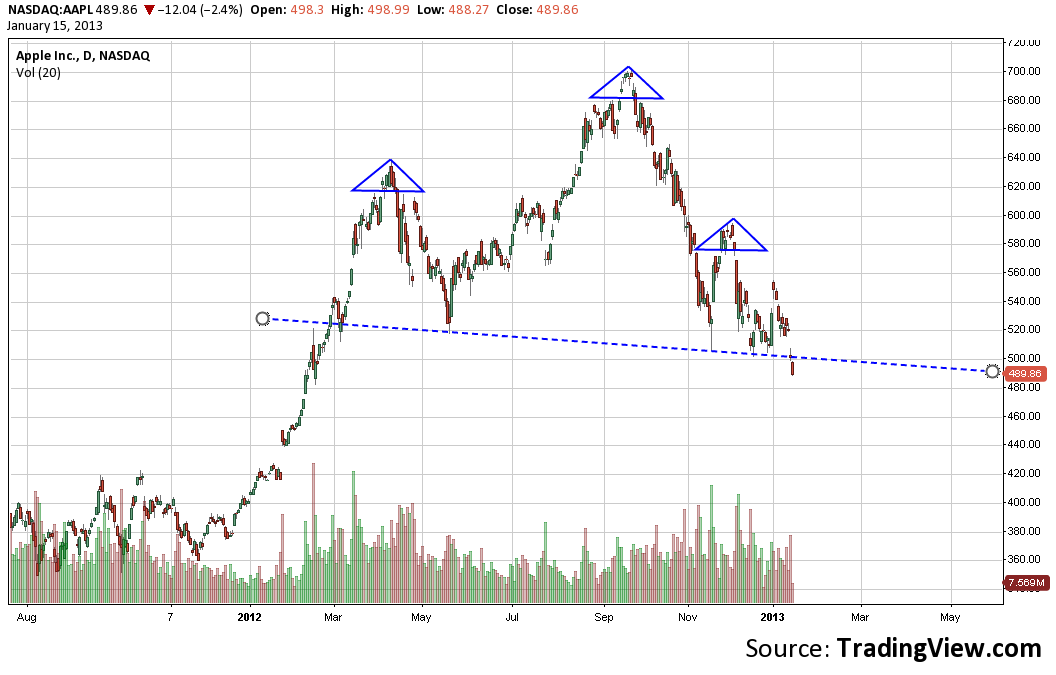
Next, @Fibline charts the foreboding Head and Shoulders top pattern with the confirmed neckline break on this morning’s gap lower. The measured move looks like 300 (ht: @CVecchioFX).
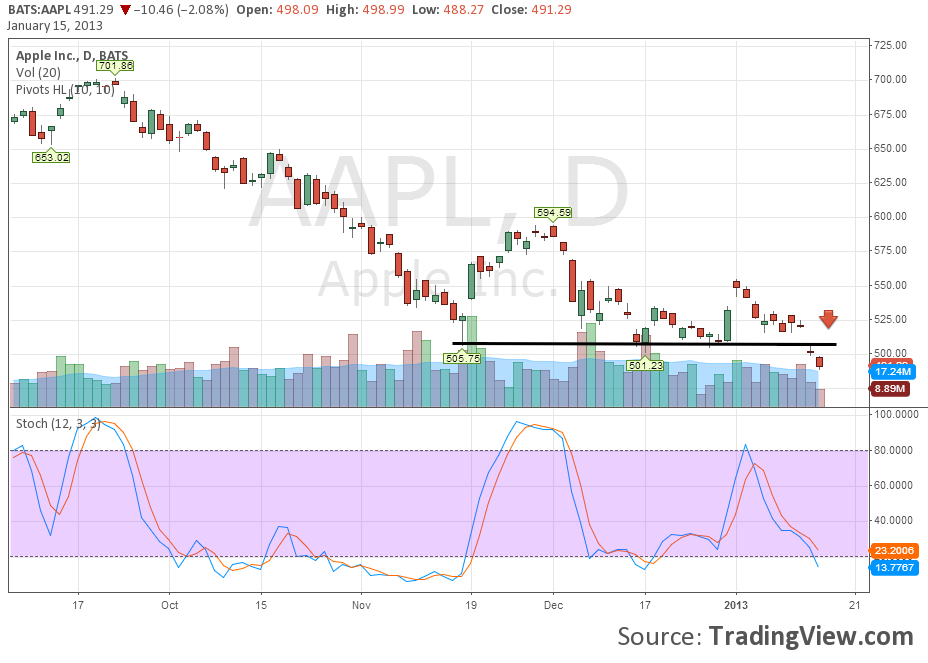
Third, @OptnTradr with a nice visualization of the critical previous support level above 500 and how that has now become resistance.
Finally, this one from @HFTAlert which shows underlying pressure in the $AAPL. Its still under aggressive distribution.
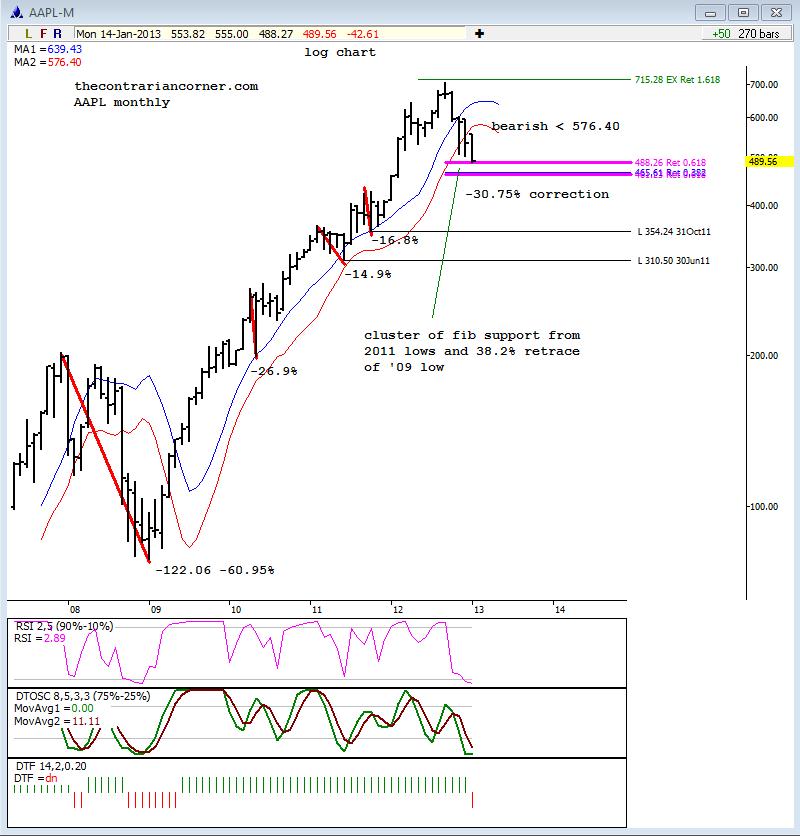
Update: Adding a 5th here via @TradingPoints highlighting the 30% correction and monthly fib cluster. Joe is one of the best at this. period.
Pingback: Tuesday links: giving up on finance - Abnormal Returns | Abnormal Returns()